Edge Collective
Assessing indoor ventilation using CO2 as a tracer gas
Using CO2 monitors to assess indoor ventilationVentilation and the risk of indoor COVID-19 transmission
(A good general reference for this topic, in the context of school classrooms, is a recent guide by the Harvard TH Chan School of Public Health: "Risk Reduction Strategies for Reopening Schools" Note, however, that some of the guidance in that document seems to pre-date the recognition of COVID-19 as spread primarily through airborne transmission.)
We know that COVID-19 is airborne (REFS), and that virus-laden airborne particles, exhaled by infected individuals, can flow like cigarette smoke, indoors.
This means that transmission is greatest among individuals who are in closest proximity; but that it is still possible to transmit the disease at a significant distance -- i.e., across a room.
A fairly good mental model is to think of the virus-laden particles exhaled by an infected individual in a typical room as building up over time like the exhalations of a cigarette smoker. If there is poor ventilation in the room, it is more likely for others in the room, or who enter the room later, to inhale some of these particles, and become infected.
The best way to mitigate COVID transmission risk is therefore to be outdoors; but we often need to interact indoors.
Three basic methods are used to reduce the amount of indoor viral exposure:
- Wearing masks: good masks, worn properly, can protect both the wearer and those around them;
- Air purifiers can be used to remove viral-laden particles from indoor air, typically recycling the 'cleaned' air back into the space, using some sort of filter-based technology (such as HEPA or MERV-13 filtration systems);
- Improving indoor-outdoor air exchange by increasing indoor-outdoor air exhchange rates: typically, by opening windows and doors, or via the HVAC system.
The first method -- mask wearing -- has been covered extensively elsewhere.
The second method -- air purification -- we cover some inexpensive, DIY approaches to indoor air purification in this post.
The third, and primary way of reducing indoor viral exposure is to imrpove the rate at which indoor air, which may contain the exhaled viral particles of infected individuals, is replaced by 'clean' air -- air that has either been recycled indoors through filtration systems, or brought into the room from outside.
Because 'bare virus' itself is difficult or expensive to detect, we assess whether these systems work typically by using 'tracers'.
In the case of filtration systems, some detectable particulate matter of the sizes that might carry viral partciles can be used as a 'tracer', in conjuction with particulate matters sensors, to estimate the effectiveness of the filters.
In the case of indoor-outdoor air exchange rates, CO2 and can be used as a 'tracer gas' by injecting an amount of CO2 into the room and using CO2 monitors to measure the rate at which this 'excess CO2' decays -- this will be related to the 'air changes per hour' (ACH) in the room, a common measure of indoor ventilation rate.
Assessing indoor ventilation using CO2
The CO2 'stoplight' method
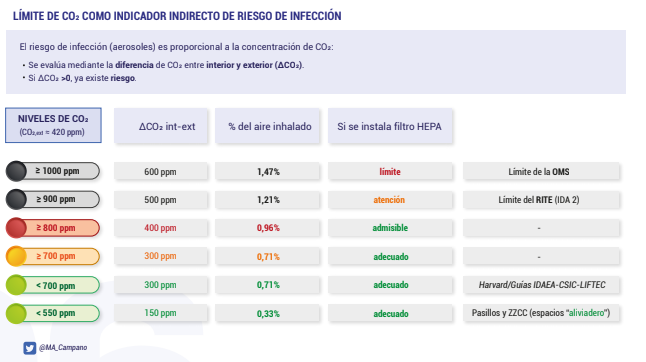
The most common source of CO2 in a space is usually human exhalation. Since the outdoor concentration of CO2 is a little over 400 PPM, if a space never gets above that no matter the occupancy level, it's a good bet that the space is well-ventilated.
Further: it's possible to estimate what percentage of the air that someone is breathing in has been exhaled by someone else -- the "rebreathe fraction". Most guidelines suggest aiming for a rebreathe fraction of under 1% -- though it's unclear whether this represents an acceptable safety threshold for a particular virus.
 |
|---|
| Figure 1. From Poppendieck thread |
Complications for this method (courtesy, Poppendieck):
- It's a very rough estimate-- we're not sure how good an estimate this is of inhaled viral load for various individuals at various levels of activity;
- It's really only a useful measurement when room is fully occupied by the expected number occupants -- which is a risky 'experiment' to run;
- Doesn't give a good indication of what will happen when room fills up further, or activity level changes -- doesn't give a sense of 'trends'.
More commentary on this can be found in "Risk Reduction Strategies for Reopening Schools":
In between commissioning events, there are several ways to test whether a classroom’s ventilation delivers sufficient outdoor air. In addition to working with trained experts, a school could quickly evaluate ventilation performance using carbon dioxide (CO2 ) as a proxy for ventilation using low-cost indoor air quality monitors. In an unoccupied classroom, background CO2 would be approximately equal to the concentration of CO2 in the atmosphere: 410 ppm. When students and teachers are present in a classroom, they exhale CO2 into classroom air at a relatively constant rate causing CO2 to rise above the background concentration. At some point, the concentration of CO2 reaches an equilibrium based on the amount generated indoors, and the amount diluted by ventilation. This is called ‘steady-state’ and can be used as a quick indicator of ventilation performance. If the measured CO2 concentrations while students are present are mostly below 1,000 ppm, then the outdoor air ventilation is likely reaching acceptable minimums. Lower CO2 concentrations while students are present mean there is acceptable outdoor air ventilation rates; higher CO2 concentrations suggest other strategies for increasing outdoor air ventilation are needed. It is important to note that CO2 measurements are only useful when a full class of students is present; otherwise, ventilation will be overestimated. Also, while CO2 measurements are a good indicator of overall ventilation, they will not indicate whether other air cleaning interventions are effective. For example, if a classroom is operating portable air cleaners to remove the virus from air, viruses and other pollutants will be removed even if CO2 remains high because cleaners with HEPA filters are not designed to remove CO2 .
Estimating ACH using the CO2 'tracer gas' method
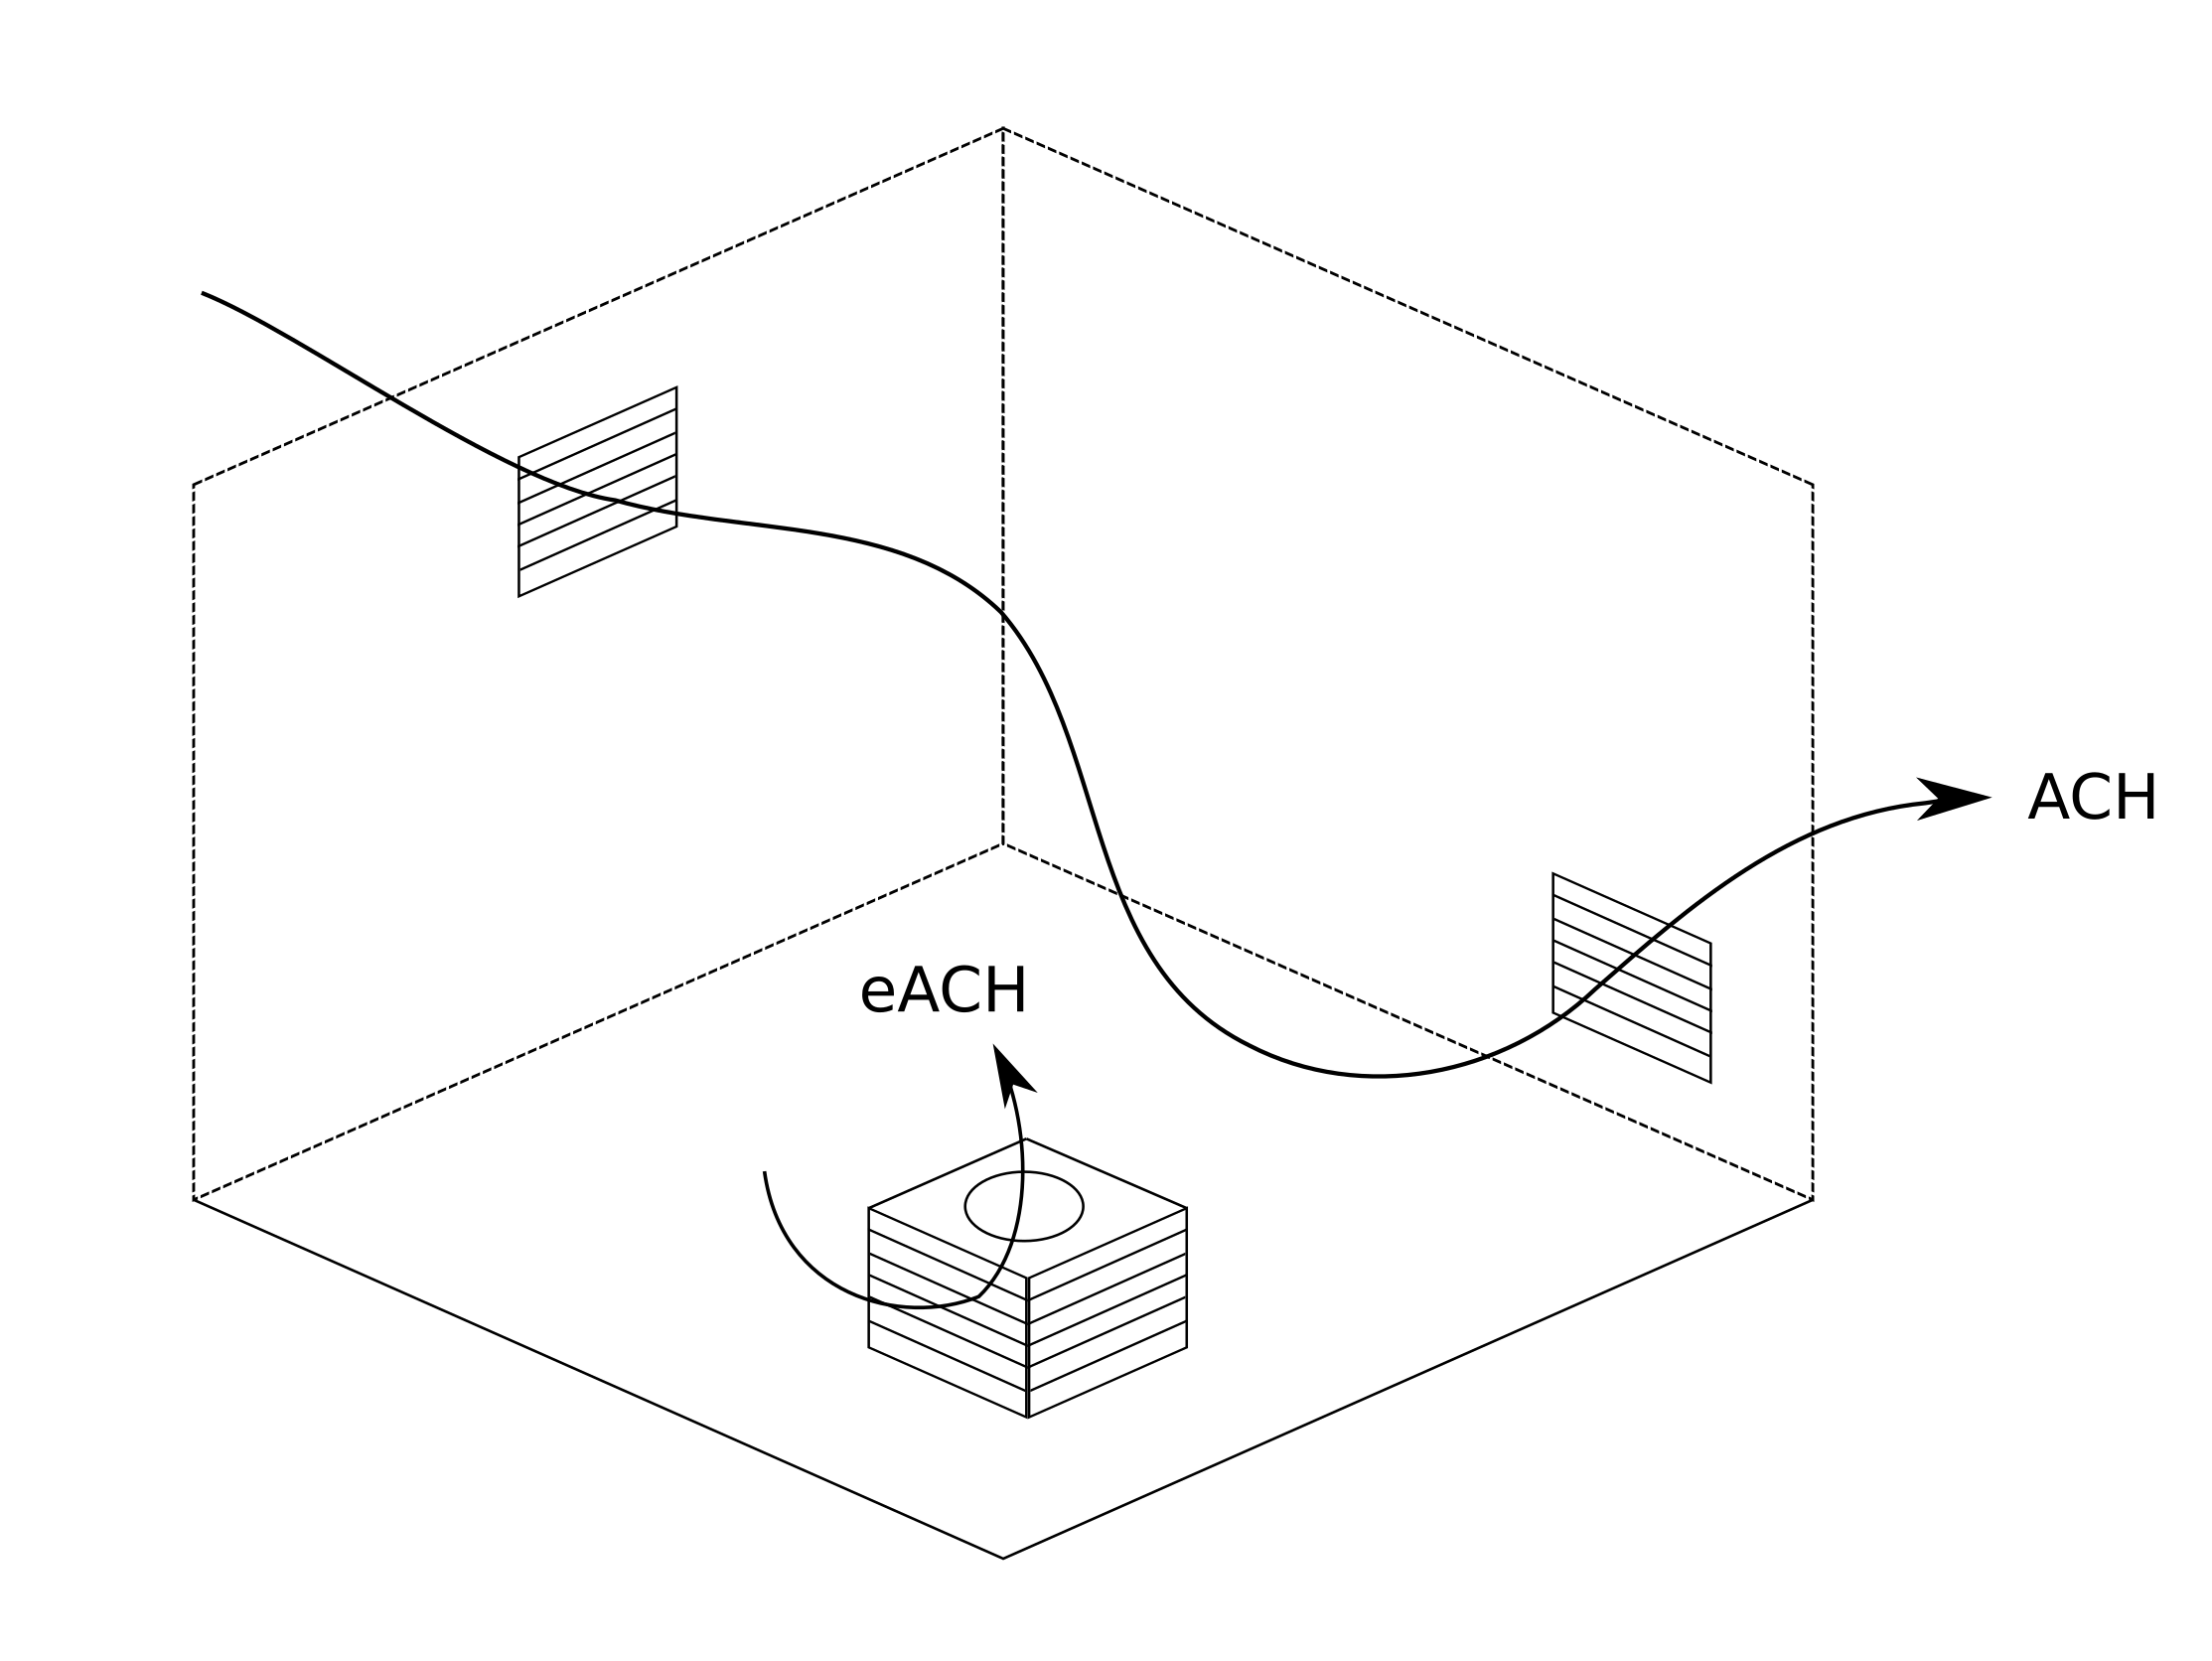
Air changes per hour (ACH): a standard measure of ventilation rates
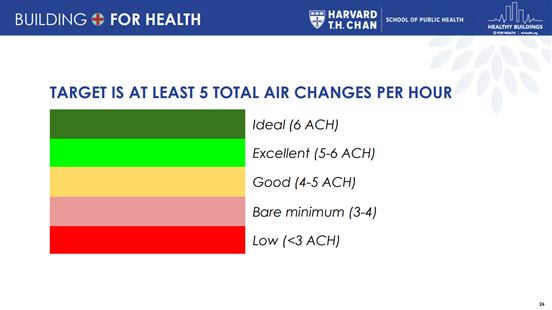
Estimates have been made for 'safer' numbers of air changes per hour (ACH) in a classroom, with respect to COVID-19:
 |
|---|
| Figure 3. From "How to assess indoor classroom ventilation". |
NOTE: these safety levels were made for the initial, 'wild-type' variant, and may be underestimates for current variants, which are considered to be more infectious.
For reference: ACH levels for typical settings:
- homes are often less than 1 ACH;
- schools are usually designed to be at least 3 ACH, though are often less in practice;
- hospital patient rooms are kept at between 6 and 12 ACH;
- hospital operating rooms are usually between 20 and 40 ACH
 |
|---|
| Figure 2. Air changes per hour (or ACH) is a standard measure of the rate at which the air in the room is replaced by outdoor air. An air purifier can remove contaminants from the air at a rate that can be expressed in "equivalent air changes per hour", or eACH. These ventilation rates are additive; the total ventilation rate in the room can be considered to be ACH_total = ACH + eACH. |
Using CO2 to estimate ACH
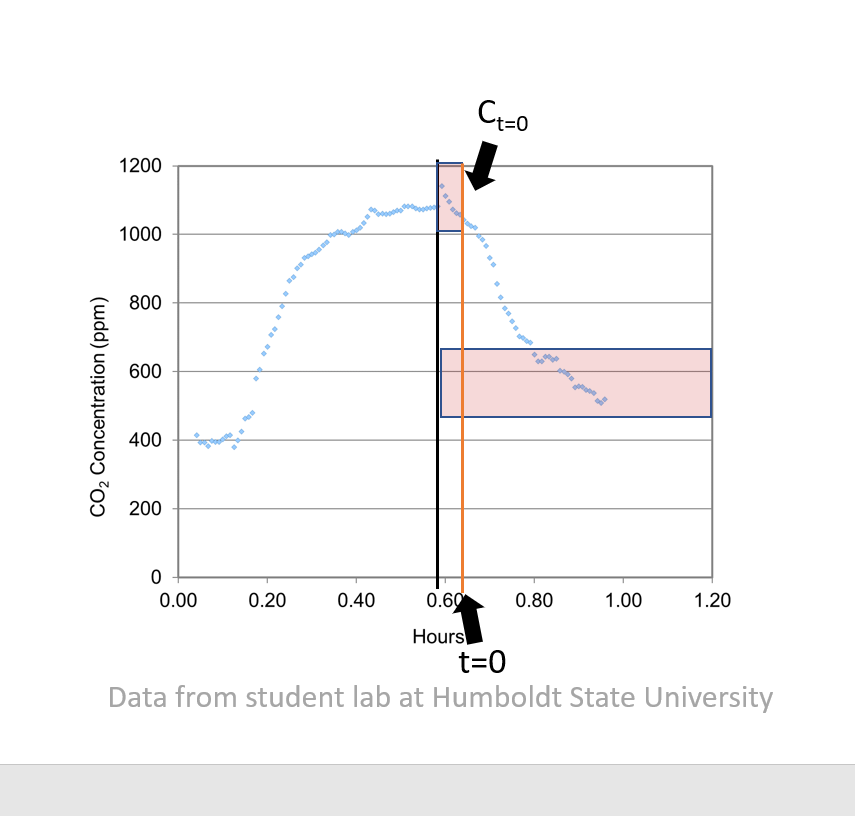
Another, more robust way of using CO2 to assess COVID-19 transmission risk indoors is to use CO2 as a 'tracer gas' to assess ACH.
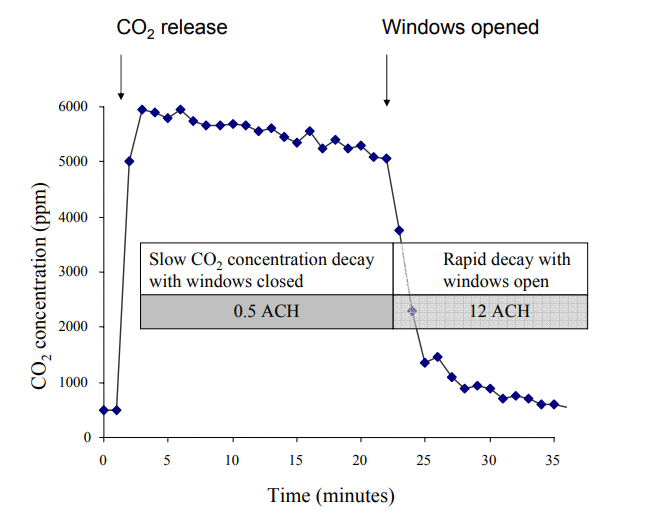
The basic idea is that we can inject 'excess' CO2 into a room (exhaled by humans, or generated some other way), then watch how long it takes for that excess CO2 to be removed via ventilation. By measuring carefully, we can use this approach to estimate a standard measure of ventilation, "air changes per hour" -- the number of times per hour that all of the room has been effectively replaced by outdoor air.
Using this 'tracer gas' approach, we only need to have a single experimenter in the room. The procedure in more detail is:
- Start monitoring CO2 level in the room, so that we know the 'baseline' level.
- Release a source of CO2 into the room for several minutes, using a fan to make sure it mixes well into the room.
- Stop the release of excess CO2 into the room (remove the source from the room).
- Monitor the CO2 level until it returns to within 10 or 20% of its initial baseline.
 |
|---|
| Figure 4. An example dataset from a 'CO2 tracer gas' experiment. After an initial baseline measurement at time=0 minutes, excess CO2 (from baking soda + vinegar) is released into the space, causing a spike in the measured CO2 ("CO2 release"). Windows in the room are initially closed, resulting in a relatively low ACH value (0.5 ACH, determined via exponential fit). Then, windows are opened, resulting in a relatively higher ACH (12 ACH). From https://www.ghdonline.org/uploads/Measuring_Air_Changes.pdf |
 |
|---|
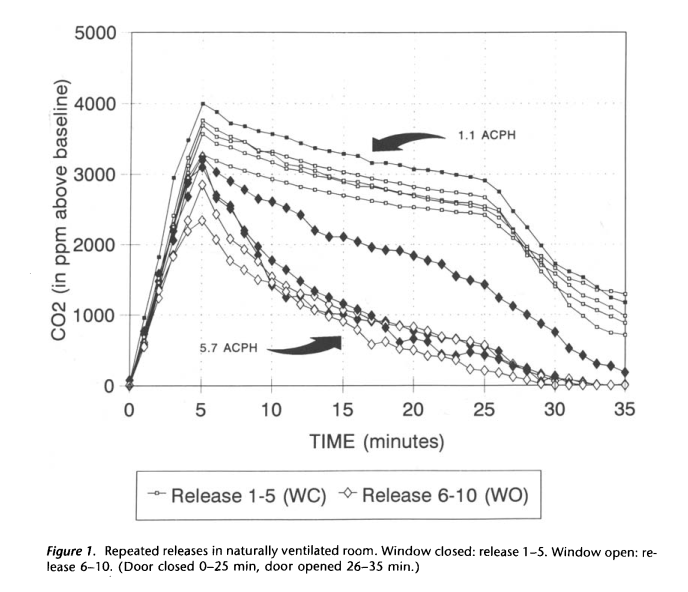
| Figure 5. From Menzies 1995. |
 |
|---|
| Figure 6. From Poppendieck Twitter thread |
Design considerations for CO2 Monitoring Devices and the 'tracer gas' method
When using a CO2 monitor for the 'tracer gas' method outlined above, particular design considerations become salient:
1. Fast response time
 |
|---|
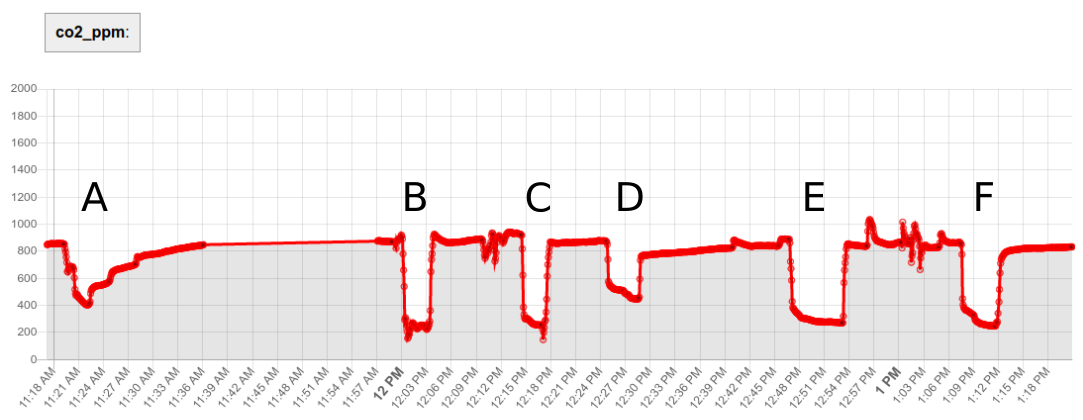
| Figure 7. CO2 Monitor Response Time Experiments. The response profiles of various enclosure options. E.g. compare the relatively slow response of option 'A' (large enclosure, few ventilation holes) with the much faster response of option 'B' (no enclosure). In both cases, the monitor was transferred within a few seconds from a higher-CO2 space into the outdoors, held there for a while, and then returned within a few seconds back to the higher-CO2 space. |
The CO2 monitor should have a 'response time' (how long it takes to measure and record the ambient level of CO2 in the room) that is as fast or faster than the rate at which CO2 is expected to 'decay' in the 'tracer gas' experiment.
If the response time is too slow, the indoor ventilation rate (in ACH) will be an underestimate.
This response time is a function both of the underyling sensor technology and design, as well as the 'enclosure' used by the manufacturer, which will allow ambient gas to be sampled / retained at a particular rate.
2. Calibration procedure
CO2 monitors require calibration in order to give accurate CO2 levels. Even after calibration, they may drift over time.
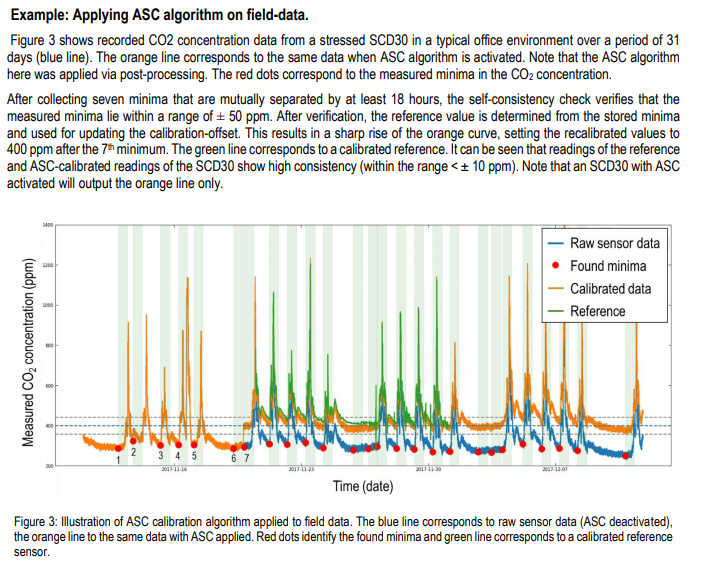
Many CO2 monitors are set up to use an 'automatic' calibration procedure that assumes that the sensor will be exposed to the equivalent of 'outdoor air' at least once per week; every week, the sensor uses the lowest CO2 value it has 'seen' over the week, assumes that this value is equal to approx 415 PPM, and calibrates its further measurements accordingly.
For many industrial spaces, this is valid assumption; when a space is unoccupied during nights or weekends, the HVAC system may bring the indoor CO2 level down to approximately the outdoor CO2 level.
But this assumption may break down for spaces that never reach ambient levels of CO2 -- e.g. whose daytime occupation is significant and whose ventilation is particularly poor.
Further -- this calibration typically occurs over hte span of a week. Practitioners who would like to perform CO2 tracer gas experiments require that their CO2 monitors are calibrated as soon as the experiment begins.
For these reasons, it's important to be able to 'force calibrate' the device -- typically by calibrating it outdoors.
3. 'Live' remote data access
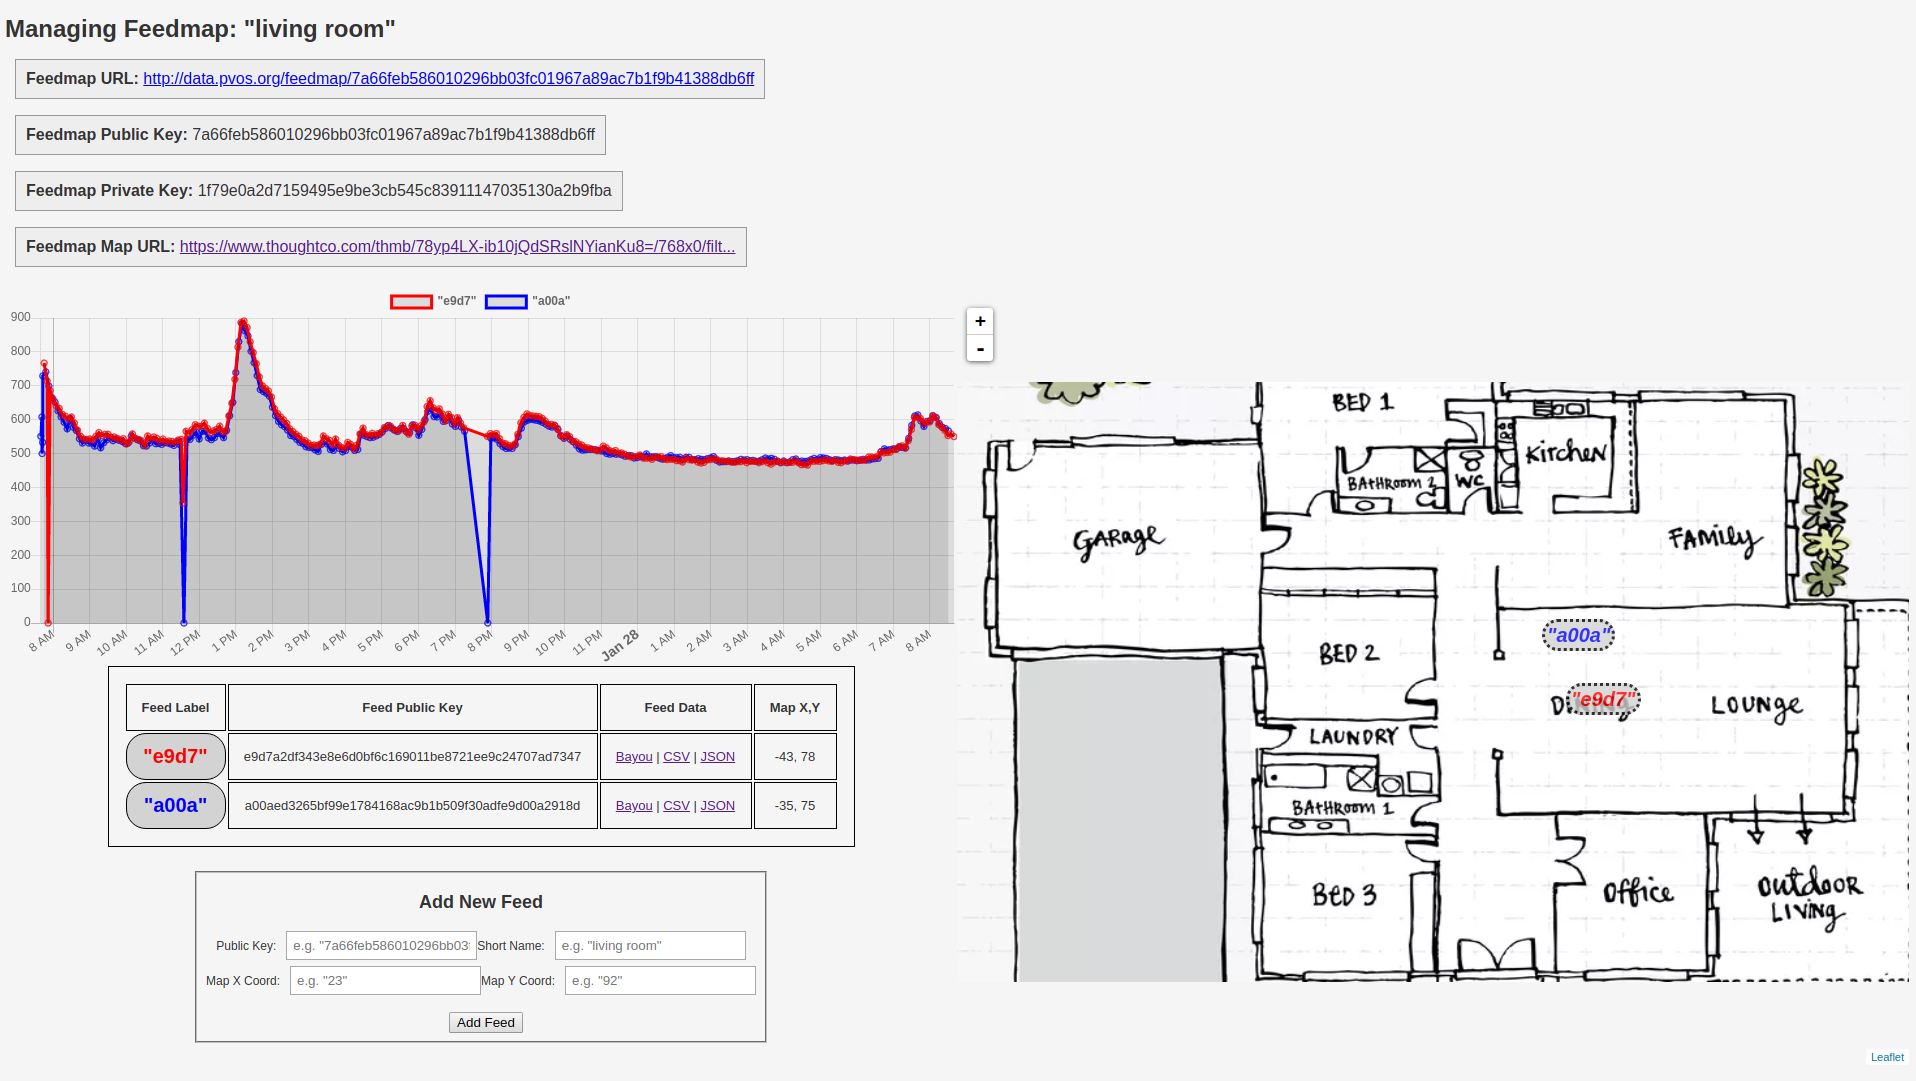
For minimizing COVID-19 risk, and for ease of data analysis, it is useful to have the data transmitted 'live' to an online database via wifi / internet.
Having the data accessible 'live' via the web means that CO2 levels can be monitored without having to enter a room. This makes CO2 tracer gas experiments more accurate (by avoiding or minimizing CO2 contributions due to experimenters in the room), and allows CO2 levels to be assessed by remote personnel without requiring additional occupants in the room, minimizing transmission risk.
Web-based access to data also makes it easy for multiple stakeholders, remote and local, to weigh in immediately their interpretation of the data.
4. Data accessibility for analysis
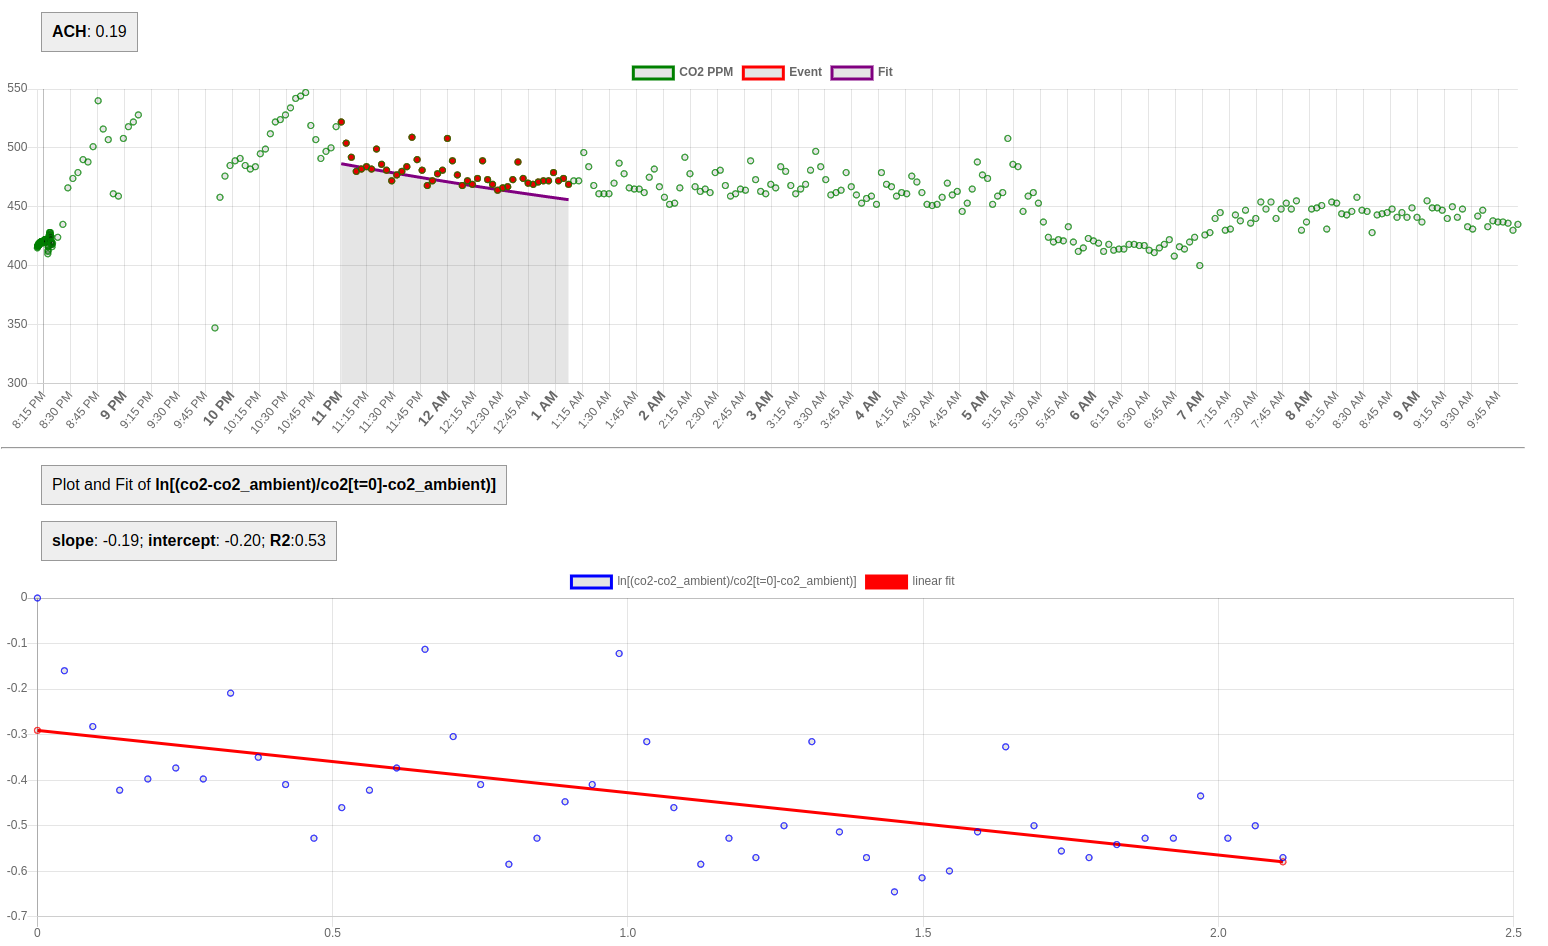
The data generated by the CO2 monitor should be in an easily-digested, easily-shared format -- e.g. a standard CSV time series.
This enables practitioners to analyze the data more readily. For the 'tracer gas' method, an exponential fit of the data must be performed; if the data is available in CSV format, this analysis can be done in a spreadsheet program, or numerical analysis programs such as Jupyter or Matlab.
Exponential fits can even be built into online web platforms, in order to facilitate this fitting procedure and generate ACH values more directly.
5. Easy to modify, upgrade, improve
Firmware bugs are unavoidable; it's useful if it possible (and easy) to upgrade the firmware on a device as new fixes emerge. New features and enhancements can also be added that way, too.
Having open source firmware and hardware designs allows for anyone who is interested to participate in an ongoing, iterative process of improvement of the device.
The case for 'open source'
Practitioners who urgently want to apply the CO2 tracer gas method to assess indoor ventilation should use any off-the-shelf, inexpensive CO2 monitors that best meet the above design criteria.
If no such devices exist, then it is useful to attempt to design a device that attempts to optimally meet these criteria, making CO2 tracer gas measurements as easy and effective as possible.
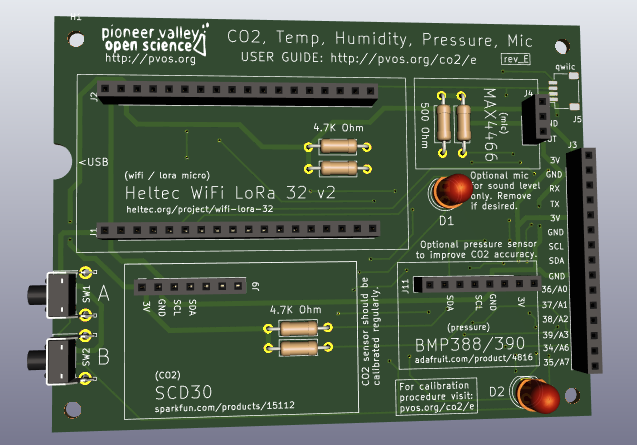
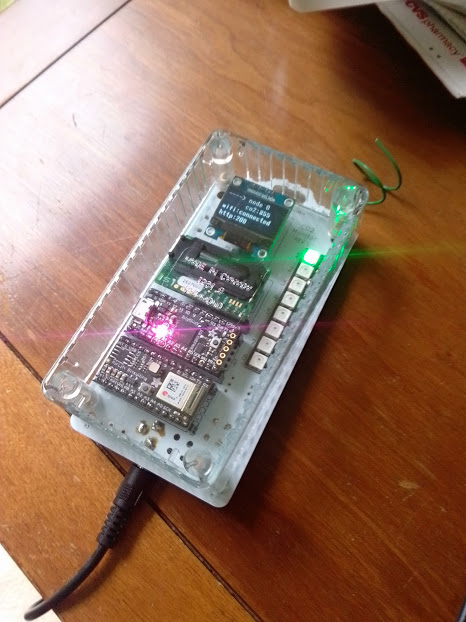
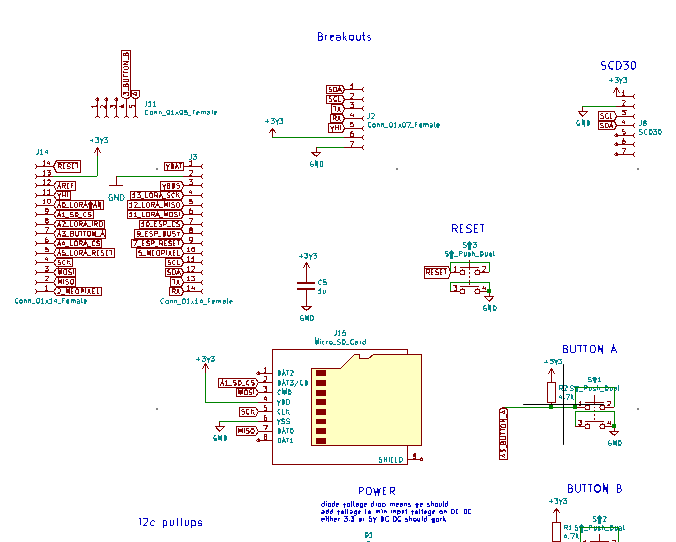
We've been working on an open source CO2 monitor design, outlined here, in order to attempt to meet this goal.
