Edge Collective
Irrigation
Notes on technology and analysis related to soil irrigationNotes on Soil Water Potential
For many decades, this topic has been the subject of intensive research, and a wide range of methods for monitoring soil moisture has been proposed (Evett, 2008). These include techniques to measure soil water content or potential as well as soil water budgets calculated on the basis of soil, plant, and climatic data.
Tensiometers are the only instruments capable of providing a direct measurement of soil matric potential due to the hydraulic connection between soil water and the water inside the tensiometer shaft.
(TODO: understand the graphs and discussion below ...)
Though water potential is a better indicator of plant available water than water content, in most situations, it’s useful to combine the data from both sensors. This is because the intensity measurement of water potential doesn’t translate directly into the quantity of water stored or needed. Water content information is also required in applications such as irrigation management and water balance studies.
Water potential data are critical to understanding when it is crucial to water, but because the data doesn’t change until it’s almost too late, water content data is also required.
Unlike water potential, the water content data (Figure 2) are more dynamic. Soil moisture sensor data not only show subtle changes due to daily water uptake, but they also indicate how much water needs to be applied to maintain the root zone at an optimal level. However, with water content data alone, it’s impossible to identify an optimal level. For example, if there were large changes in water content over four or five days, researchers might assume, based upon on-site observations, that it’s time to irrigate. In reality, they know little about the availability of water to the plant. Thus, it’s useful to put the two graphs together (Figure 3).
 |
|---|
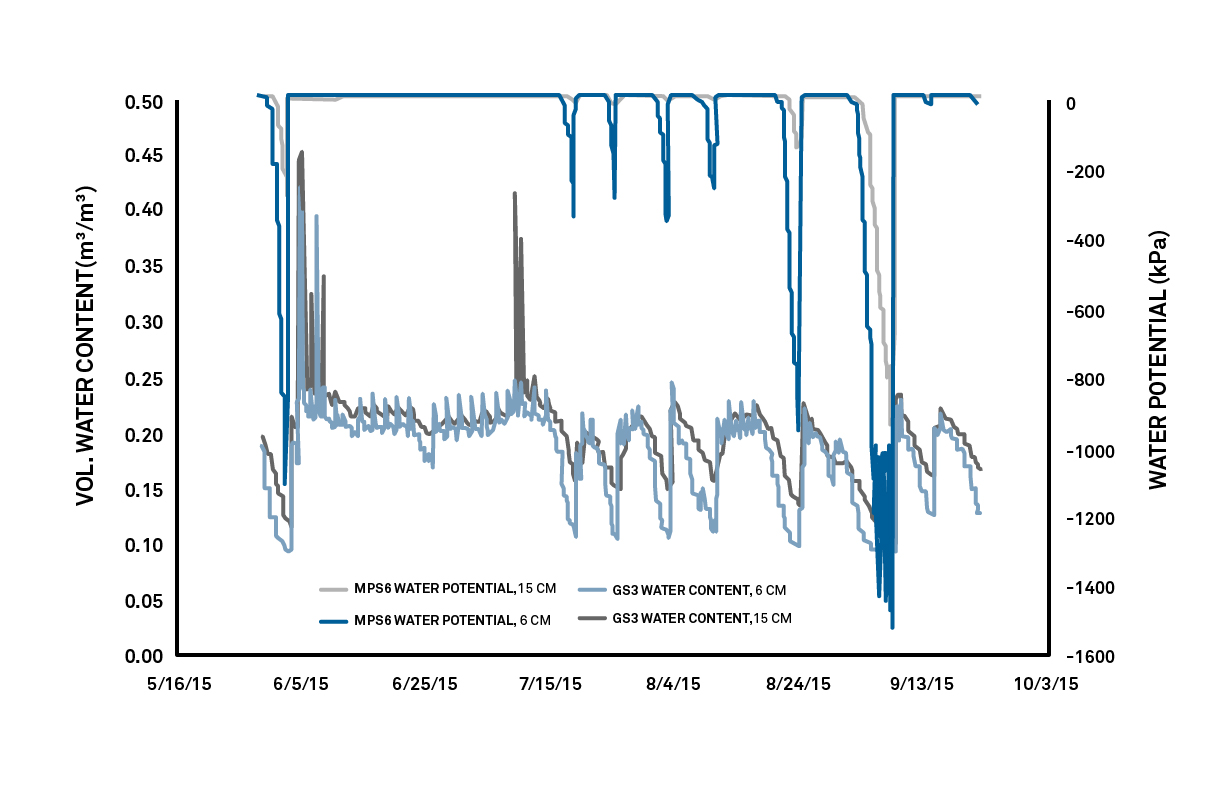
| Fig 3 from https://www.metergroup.com/crops/articles/when-to-water/. |
Figure 3 illustrates the total soil moisture picture. Researchers can observe where water content declines and at what percentage the plants begin to stress. It’s also possible to recognize when the soil has too much water: the water content is above where water potential sensors start to sense plant stress. Using this information, researchers can identify the turfgrass optimal range at 12% to 17% volumetric water content. Anything below or above that range will be too little or too much water.
What Do The Readings Mean?
In an unsaturated soil, soil water tension—frequently called the “suction” — falls below atmospheric pressure. As wet soil dries, the soil-water suction increases, causing water to flow out of the tensiometer through the porous cup. The small pores of the saturated cup prevent air from entering the tensiometer. This outflow of water creates a vacuum inside the tensiometer and increases the reading on the vacuum gauge. If the soil is rewetted by irrigation, water will be drawn back into the tensiometer, reducing the vacuum inside, and the reading on the gauge will decrease. The vacuum gauge measures the suction in centibars, with a range of 0 to 100. A reading of zero indicates a saturated soil in which plant roots will suffer from poor aeration. A reading of 10 to 25 centibars reflects a soil at field capacity. The lower reading is for sandy soils at field capacity, and the higher reading is for finer-textured soils. Readings of 70 to 80 indicate a dry soil. Tensiometers will not read above 85 centibars.
Tensiometers do not provide information on the amount of water depleted from the soil unless they have been calibrated for the particular soil type. They therefore indicate when to irrigate, but not how much to irrigate.
2021-03-31 08:32:47
2021-03-31 09:20:15
soil probes https://thecavepearlproject.org/2020/10/27/hacking-a-capacitive-soil-moisture-sensor-for-frequency-output/
2021-04-21 08:00:02